This is where inexperienced traders can fall into a trap. There is an
old saying on wallstreet that gaps must be filled. Therefore, when a
breakout gap occurs, many traders get caught and lose money by shorting
the gap because they think it must be filled. Breakaway Gaps may
eventually be filled, however they represent a change in trend and are
very bullish. Typically, the gap may take months, even years to fill.
Breakaway gaps represent a low risk entry point for a long position if
they are bought early on, especially on the day the gap occurs. Breakaway
gaps, sometimes upon breakout, will pullback for a few days. Use this
pullback as a gift and either add to your long posistion or go long if you
missed the day of the gap up.
Breakaway Gaps and Negative Divergence
How should one trade breakaway gaps? The breakaway gap should be bought ideally on the day of the gap up or on a pullback shorly after the gap occurs. Now, the big question is, how long should one hold the postion? One thing I've found very useful is that after Breakaway Gap has a substantial run-up, Negative Divergence usually warns the trader that the rally is over, and to exit the long position. Therefore, when buying breakaway gaps, look for negative divergence as your warning to exit the position. For more information of negative divergence, go to the education section on Negative Divergence.
Now that you understand something about descending triangles, it's time
for some real chart examples. Please note that I will be adding
more examples as I find them.
The chart below of Yahoo is a good example of breakaway gap and it’s bullish nature. Yahoo was in a downtrend from May of 2002 until early October 2002, as noted by the clearly defined downtrend line. The gap on October 12th cleared this downtrend resistance line on very high volume which confirmed the pattern. Many traders shorted Yahoo on the day of the gap up as well as many days afterward based on the poor fundamentals of this internet stock. This decision obviously was unwise and cost many traders lots of money, especially those who added to their short position on the way up.
Notice how Negative Divergence occured after the substantial rally - the astute technical trader would have used this to exit their long position.
This example also illustrates how trading in the short term off
fundamentals can get one into trouble. Long term, fundamentals eventually
win out, but in the short term, technicals rule. Read the section on
Technical Analysis for more information on technicals vs. fundamentals.

Another good example of a breakaway gap is HYGS below. Again, the gap on huge volume that cleared the downtrend line confirmed the bullish gap. Shorts got killed, whether they continued to hold after the gap or the ones who shorted the gap. Longs who bought in after the gap were well rewarded with a 150% move from the gap. Also of note, the gap usually becomes support and is often retested shortly after the gap occurs. Consider the retest of the gap support as a ‘second chance’ and a good low risk place to go long if you missed the first opportunity.
Again, notice how negative divergence occurred after the substantial rally.
The astute technical trader would have used this to exit their long position.

:
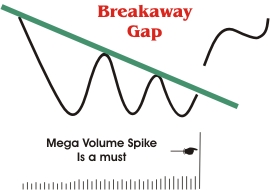
Summary of what to look for in a Breakaway Gap:
- Extended and well defined downtrend line
- A gap that clears the downtrend line with big volume.
- The gap generally becomes support and can often be bought if
you missed buying the day of the gap up. Note, the gap isn’t always retested
and should be thought of as a ‘gift’ from the heavens.
- Watch for negative divergence after the run-up.