Important Bull Market Results
Overall performance rank for up/down breakouts (1 is best): 19 out of
23; 19 out of 21
Break even failure rate for up/down breakouts: 11%; 20%
Average rise/decline: 29%; 15%
Throwback/pullback rate: 47%; 65%
Percentage meeting price target for up/down breakouts: 68%; 32%
Identification Guidelines
|
Characteristic |
Discussion |
|
Price trend |
Can be up (66% have a rising price trend) or down (34%) leading
to the pattern. |
|
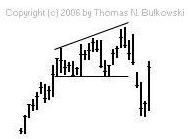
Shape |
A megaphone tilted up with
the bottom horizontal. |
|
Trendlines |
The bottom trendline is horizontal,
the top one slopes upward. |
|
Touches |
At least two peaks and two
valleys should touch their respective trendline. |
|
Volume |
Trends upward 54% of the time
and downward 46% of the time. |
|
Breakout |
Downward 66% of the time. |
Trading Tips
|
Trading Tactic |
Explanation |
|
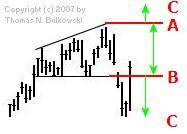
Measure rule |
Compute the height from the highest peak
(point A in the Measure Rule figure to the right)
to the horizontal trendline (B) and multiply it by the
above “percentage meeting price target.”
Add the result to the highest peak (A, upward
breakouts) or subtract it from the horizontal trendline
(B, downward breakouts) to
get the price target (C). |
|
Intraformation trade |
Buy at the horizontal trendline
when price starts rising and sell or sell short once price turns at the top trendline. |
|
Buy at 3rd touch |
When price touches the horizontal
trendline for the third time and begins rising, buy. |
|
Partial rise |
A partial rise works 74% of
the time. |
|
Partial decline |
A partial decline works 81%
of the time. |
|
Price trend |
The best performing patterns
are those with a short-term (less than three months) rise leading to the pattern. |
|
Yearly high, low |
Downward breakouts perform best
when the breakout is within a third of the yearly low. For upward breakouts, performance is best when the breakout is within
a third of the yearly high. |
|
Volume trend |
A downward volume trend results
in the best postbreakout performance. |
|
Throwbacks and pullbacks |
Throwbacks and pullbacks hurt postbreakout
performance. |
|
Height, width |
Tall patterns perform better than short ones.
Wide patterns (upward breakouts) and narrow patterns (downward breakouts) perform well. |
|