Important Bull Market Results
Overall performance rank for up/down breakouts (1 is best): not ranked
Break even failure rate for up/down breakouts: 11%; 16%
Average rise/decline: 31%; 14%
Throwback/pullback rate: 32%, 13%
Percentage meeting price target for up/down breakouts: 42%, 12%
The above results are preliminary, based on a sample of 202 qualifying
patterns (151 with upward breakouts, 51
with downward breakouts). The percentage meeting price target for down breakouts
showed that just 6 hit the target and the
pullback rate used just 26 samples. The numbers are likely to change.
Identification Guidelines
|
Characteristic |
Discussion |
|
Price trend |
Can be any direction leading
to the pattern. Best performance comes from patterns with price trending upward leading to the pattern. |
|
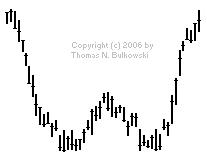
Shape |
A big W shape with twin bottoms
and tall sides. |
|
Reversal pattern |
Look for a double bottom reversal
pattern at the base of the big W. |
|
Tall sides |
The best performing big W chart patterns have tall,
straight declines leading to the bottom of the big W. |
|
Left side decline |
The decline leading to the
first bottom should be at least 1.5 times the rise between the two bottoms for best performance. |
|
Double bottom |
The double bottom should have
twin bottoms with lows less than 4% apart. |
|
Rise between bottoms |
The rise between the valleys
of the double bottom is 10% to 20% or more. |
|
Volume |
Recedes 60% to 63% of the
time for up/down breakouts respectively. |
|
Breakout |
Look for an upward breakout.
That’s when price rises above the right side of the big W. |
|
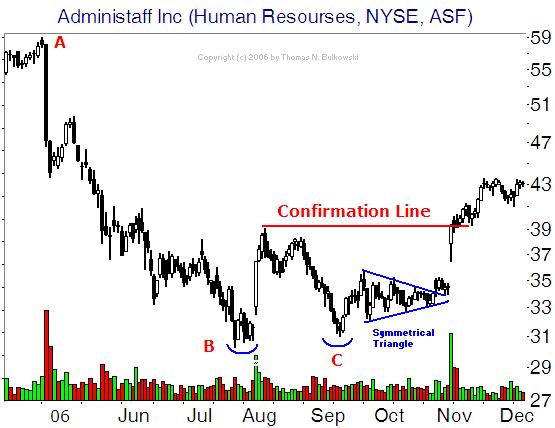
Confirmation |
The pattern confirms as a
valid one when price closes above the highest peak between the double bottoms. |
Trading Tips
|
Trading Tactic |
Explanation |
|
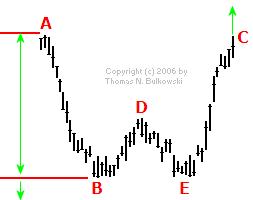
Measure rule |
Compute the height from the highest peak (usually the left
side of the big W, point A in this example) to the
lowest valley (B) and then multiply it by the above
“percentage meeting price target.” Add the result to the right side of
the big W (upward breakouts, C) or subtract it from
the lowest valley (downward breakouts, B).
The result is the target price. The link to the left gives more information about
the measure rule. |
|
Breakout |
Upward breakouts occur when price closes above the right
side of the big W (C). Downward breakouts occur when
price closes below the lowest valley in the big W (B).
|
|
Stall |
For swing traders, buy at the double bottom low (E) and ride
price upward to confirmation of the double bottom (the high between the two
bottoms, D). Price often pauses there. If price drops
below the low of the second bottom (E), exit the
position immediately. If price confirms the double bottom, expect a rise
approaching the left side high (A).
|
|
Position traders |
Wait for confirmation of the double
bottom before taking a position and be prepared to sell as the stock nears the
price of the left side high (the price at C approaches
the price at A). |
|
Left side high |
The right side high of the big W (C) reaches the price at the start of the pattern (A) 46% of the time. |
|