The Charts
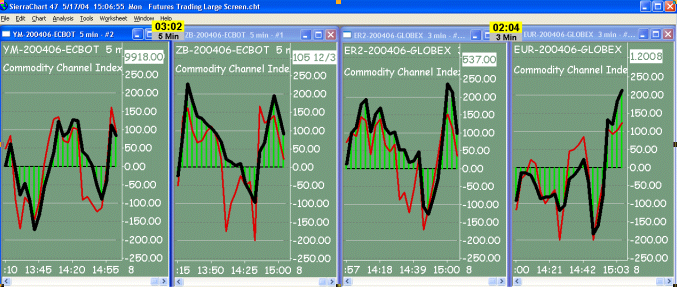
The snapshot above is a complete set of charts that are
used to trade Woodies CCI system. There are four different markets and only
one time frame for each market.
We are showing the YM and the ZB on a 5 min chart, and
also the ER and the EUR currency futures on a 3-minute chart. We don’t
change symbols or time frames during our trading day in Woodies CCI system.
Absolutely everything we need is right there on that set of charts to trade
4 markets. In fact if we only want to trade a single market then we only
need one of those charts. We look at nothing else at all. Simple.
Notice a few things about these trading charts. Clean.
Simple. No Prices. And the CCI patterns are the only thing that jumps out at
you. Everything else fades away into the background. No Distractions. This
is very important to successful trading. You have to have the CCI pattern
stand out like its 3-D. You have to be able to see only it from across the
room. Fade all other things into the background. We only focus on the
pattern.
Notice another thing about the charts. 1 chart with 1
market with 1 time frame. Simple.
Woodie only uses two CCI indicators to trade with. One
is the CCI 14 period, shown as black, and called CCI. The other one is the
CCI 6 period, shown as red, and called Turbo CCI or TCCI. The CCI formula
uses the (H + L + C) / 3 calculation and has a
multiplier of 0.015.
Woodie himself may have price bars, Woodies pivots and
even the 34-ema showing on the charts he pushes to the room in real-time.
But he does NOT use them to trade with. So you won’t either.
Do not put additional things mentioned above on your
charts at all. They all work to some degree. But do not add any of them.
They are not needed. If Woodie doesn’t use them to take trades then why
should you?
Woodie only looks at one chart for each market he
trades. He does not look at different time frames for confirmation. Each
chart has only one time frame on it. Mostly he uses a 3-minute, 5-minute or
a tick chart of some set number such as 33, 89 or 133 tick. Ask the room
what Woodie uses as a time frame for a given market. Use that only and do
not change it. Follow what Woodie does.
Woodies charts are set to display data for the normal
market hours only. He does not use pre and post market data on his charts to
trade with. This will change the CCI patterns at the beginning of the market
if you do not use the same data display hours. Make one single chart with
one single time frame for each market he trades. Set the data display time
frame for each chart. For example most markets will be from 9:30 am to 16:15
pm EST. The bonds will be from 8:20 am until 5:00 pm est. Currency futures
like the Euro and Yen are set to 24 hours.
Woodie does not change charts around, add things,
subtract things or change time frames at all. He keeps them the same all the
time. He does not switch time frames to see different patterns. He doesn’t
use larger time frames or smaller to confirm his CCI patterns, entry or exit
signals. You should not do this either.
Set up your charts with exactly what Woodie uses to
trade with. Do not modify them in any way. All you need to put on your
charts is the CCI indicators set to 14 period and 6 period CCI. Set the
background colors so that it is not standing out. Set the text size and
color and any other items on the screen so that they do not stand out.
Make the two CCI indicators stand out as much as
possible. Make them thick. These are the only things we want to have pop out
at us when we are trading. No other information is important. If something
other than the CCI pattern itself is standing out then you will focus on it
and it will degrade your reaction time.
Remember that you are making trades based on one single
chart with one single time frame. If that chart is a 3-minute chart then you
can’t expect to stay in very long. We are daytrading. We move fast. It
doesn’t matter if the prices keep moving and we could make more profit. You
have to follow the system and do not second-guess it at all. Woodies CCI
takes plenty of profit out of the market each and every day.
All you are supposed to do all day long is wait for a Woodie CCI pattern to scroll by. It should be boring. Good trading is defined as boring. Get over it. We wait for a CCI entry signal. We enter the trade. We wait for a CCI exit signal. We exit the trade. It is simple, well defined, very clear and works very well.
Notice the 2 count down timers on the charts above.
They are the small almost square blocks. They show the time that is left
before the CCI bar will print and create a new CCI bar. These can be used to
time your entries. You will learn more about this later on.
New people love to add things to their charts because
they do not know what else to do. Don’t do this. Once you add the CCI
signals to your charts and remove prices you are done! Woodie doesn’t use
price bars to trade and you do not need them either. If you are new to
Woodies CCI, now, and I do mean right now, is the best time to learn this.
Do not make excuses about how you can’t trade without it and your other indicators or how you are learning to not need them. You are wasting your time. You can’t afford to trade with these things any longer. It increases the learning curve dramatically. It would be like learning to use a cane for walking in outer space. It will keep you from focusing on the task at hand. Don’t add anything else to your charts. Only use what Woodie uses.
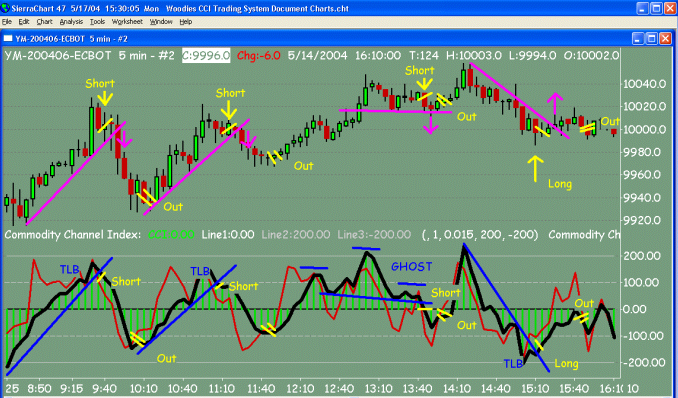
1 Chart Above – Woodies CCI Trades Showing Price Bars.
In the chart above you will see 4 Woodie CCI trades taken. The single yellow lines are trade entries and the double yellow lines are trade exits. Blue lines were used to outline the CCI trade pattern.
There were several other trades there as well. However, only 4 were shown. Those taken were a TLB short, a TLB short, a Ghost short and a TLB long. We take trades without looking at price bars. So should you. You will not do well if you look at price bars. Your performance will suffer because you are using them. You cannot learn Woodies CCI system while watching prices. The excuse that you still need them is absolutely wrong.
Of the 4 trades shown you can see that the first 2 TLB trades, from left to right, made very nice profits, and the next two trades, the Ghost and the TLB, made a very small profit and the other one a very small loss or b/e at best. Woodies CCI system controls your losses and lets your winners run.
It is very important to notice that Woodies CCI system will most often get you in 1 or more bars before the rest of the world. This is your edge! The pinkish purple lines drawn on price show you where people
might enter the 4 trades based on the break of price bar trend lines. Each and every single price bar trend line break entry shown is 1 or more bars later then Woodies CCI entry. That costs you smaller profits, larger losses and sometimes can even turn out to be a disaster!
Notice the Ghost entry we took didn’t go far on this particular trade but we still snagged a very small profit. But the price bar trend line method put you short and the market turned on you immediately after that for a nasty loss because you probably wouldn’t exit until it broke the upside of that range. With Woodies CCI we exited with a small profit within the range because we got the CCI entry and exit signals right on time. This is a perfect example of how Woodies CCI system is protecting you, giving you small losses and large profits automatically.
The chart above shows prices to help you see that Woodies CCI trade patterns can be taken regardless of whether prices are watched or not. If we remove the section showing price bars won’t we see the exact same CCI entry and exit signals? The answer is YES! So this should show you that you don’t need price bars to take the trades in Woodies CCI system. And since you don’t need price bars and watching them creates stress and emotions while trading then why on earth show them on your charts while learning Woodies CCI system? The excuse that you need them while learning is ridiculous. Woodies CCI system doesn’t use them.
Controlling your costs while keeping it simple is very
important when trading. You can use Sierra Charts
www.sierrachart.com for charts at
only $80 a year, Interactive Brokers
www.InteractiveBrokers.com
for both a free data feed and also as a universal trading account from which
you can trade anything under the sun. You can find various free count down
timers to time your trade entry at
www.woodiescciclub.com. Woodie uses Sierra Charts, IB and the countdown
timers with excellent success and so can you.
All these tools are very inexpensive, work perfect and
are widely used to trade Woodies CCI system. This is because it is a very
simple system, uses very few indicators and doesn’t require the need for
historical data. Get over your need to have fancy chart features, historical
data and expensive tools. They are just not needed any longer. Save your
money. This is one of the many wonderful benefits of trading Woodies CCI.
While learning the system they are a completely viable low cost option.